Simulating 21-cm Foregrounds: Convolving Sky Maps with Beam Patterns
Simulating 21-cm Foregrounds: A Toy Example
Understanding and modeling radio foregrounds is crucial for 21-cm cosmology experiments. The foregrounds are from synchrotron and free-free emission in our own and other galaxies and they are around 5 orders of magnitude brighter than the sky-averaged 21-cm signal between 50 and 200 MHz. This post demonstrates a simple but illustrative example of how foreground signals are observed by radio telescopes through the convolution of sky brightness maps with instrument beam patterns.
The Physics
In radio astronomy, the observed sky brightness temperature is the result of convolving the true sky brightness with the instrument’s beam pattern:
\[T_\mathrm{observed} = \int T_\mathrm{sky}(\theta,\phi) \times BG\theta, \phi) d\Omega\]where $T_\mathrm{sky}(\theta,\phi)$ is the sky brightness temperature at position $(\theta, \phi)$, $G(\theta, \phi)$ is the normalized beam pattern and the integral is over the solid angle.
Implementation
Our simulation uses the Global Sky Model (GSM) through the pygdsm interface to generate realistic sky brightness maps across different frequencies and convolves them with a simple Gaussian beam pattern. The beam pattern here has a full width at half max $F$ of 100 at 150 MHz and this is scaled according to
\[\sigma = \frac{1}{2 \sqrt{2 \log 2}} \mathrm{F}_\mathrm{150} \frac{150}{\nu}\]where $\sigma$ is the standard deviation of
\[G = \exp(-\frac{D_A^2}{2 \sigma})\]and $D_A$ is the angular distance of each pixel in the beam from the observer’s zenith. Pixels below the horizon are masked out since the instrument won’t see the sky below 90$^\circ$ (assuming the horizon is flat). The gain is normalised such that its maximum value is 1.
Both the gain and the sky temperature are returned as healpy maps meaning that the convolution can be taken by taking an average of the product of the beam and sky at each frequency.
Key Components
- Sky Model: Uses the GSM to generate frequency-dependent sky brightness maps
- Beam Pattern: Implements a Gaussian beam with frequency-dependent FWHM
- Convolution: Performs the spatial convolution in HEALPix pixelization
Code Structure
The main simulation (main.py:16-25) loops through frequencies from 50-130 MHz:
for i, freq in enumerate(frequencies):
    brightness = sky(freq, time, lat, lon, elevation)
    nside = hp.npix2nside(len(brightness))
    beam_pattern = gaussian_beam_healpix(nside, freq, fwhm_0=100.0)
    temperature.append(np.nanmean(beam_pattern * brightness))
Results
Sky Brightness and Beam Pattern at 130 MHz

The left panel shows the sky brightness temperature from the GSM at 130 MHz on a logarithmic scale. The galactic plane is clearly visible as a bright band in the sky, with synchrotron emission dominating at these frequencies. The right panel shows the Gaussian beam pattern (G) used in the convolution.
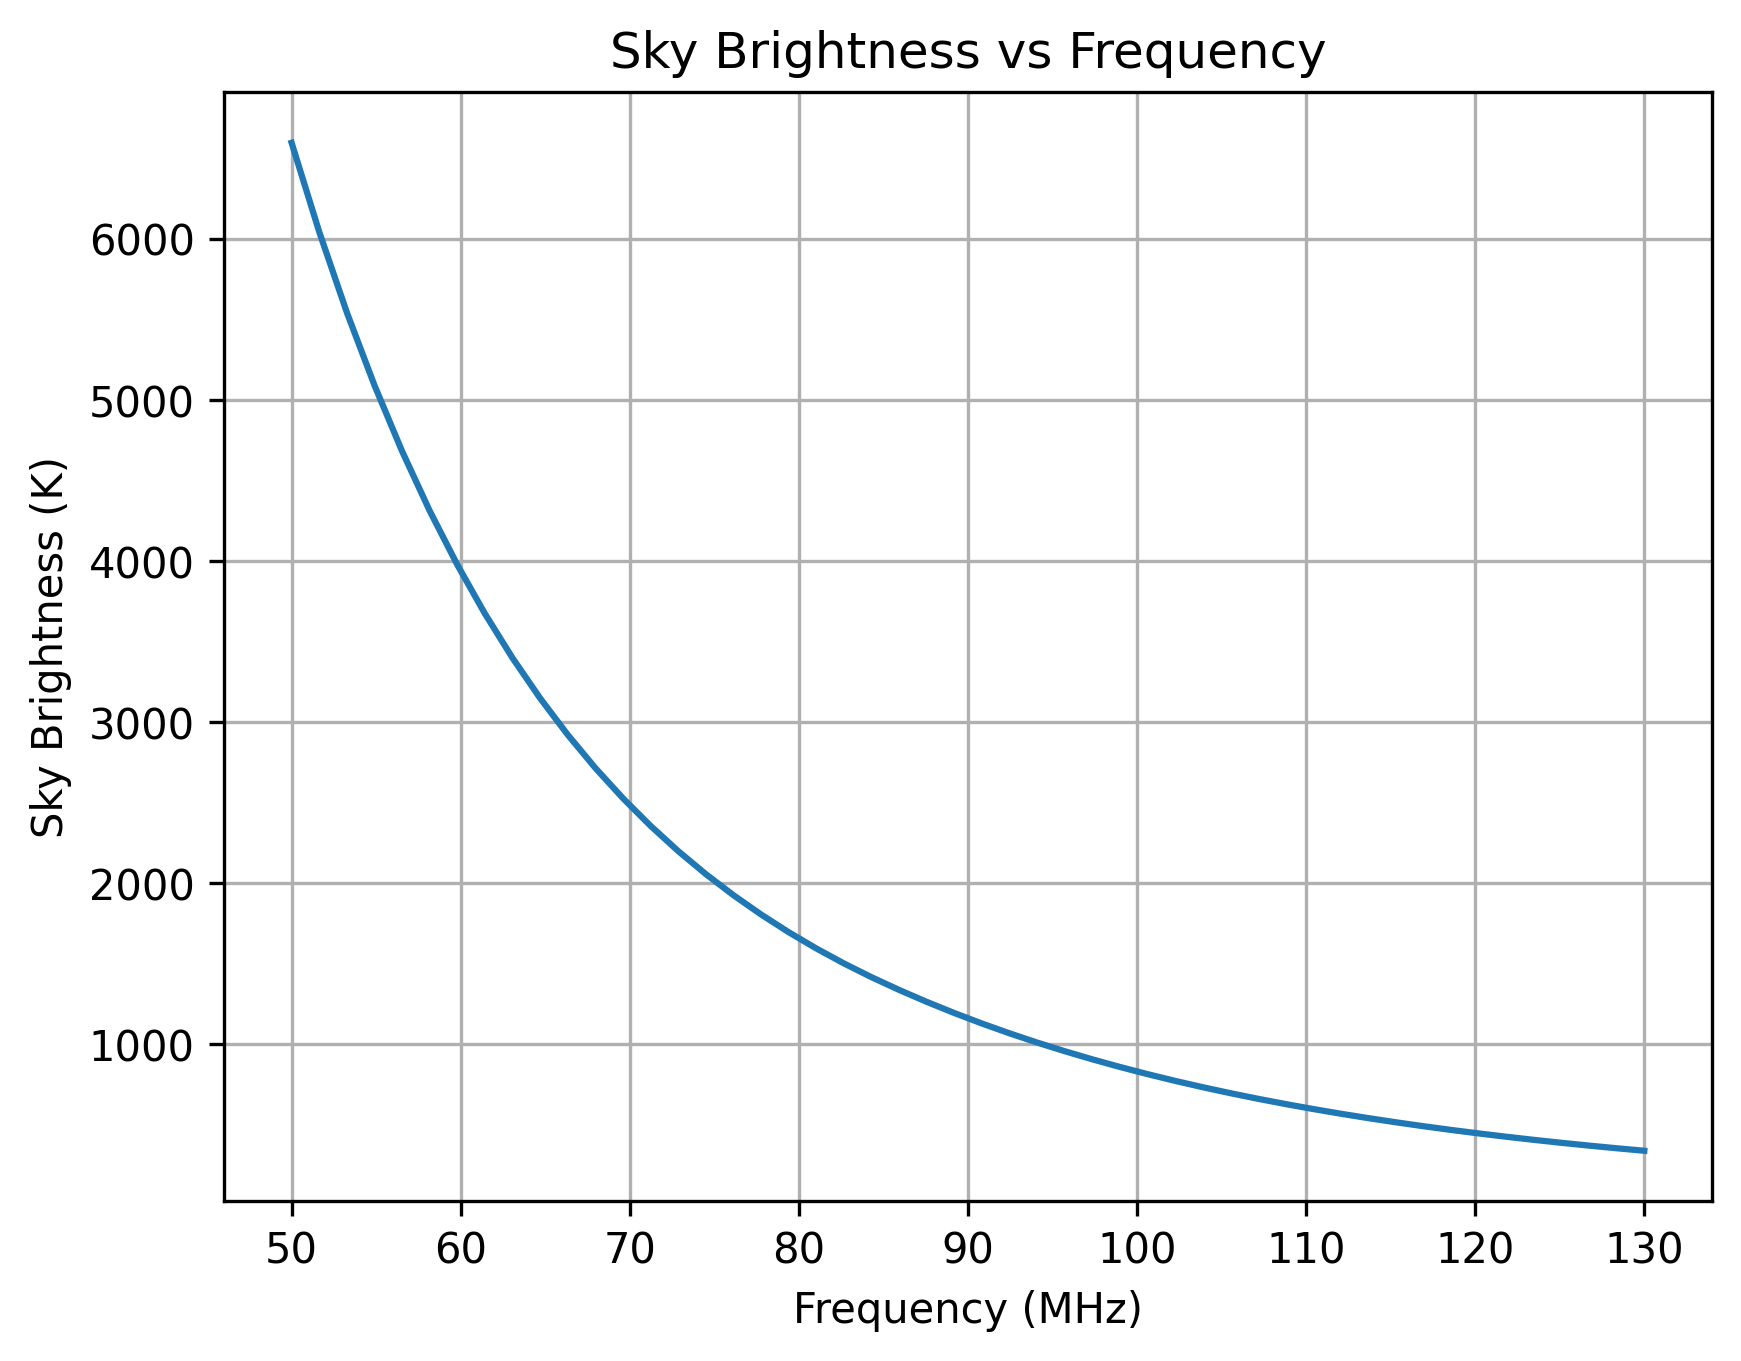
Frequency Dependence

The convolved sky brightness shows the expected steep frequency dependence, dropping from ~6500 K at 50 MHz to ~400 K at 130 MHz. This $\approx \nu^{-2.5}$ scaling is characteristic of galactic synchrotron emission, the dominant foreground component at these frequencies.
Physical Interpretation
The simulation demonstrates several key aspects of 21-cm foreground modeling:
- Spectral Smoothness: Foregrounds vary smoothly with frequency, unlike the 21-cm signal
- Spatial Structure: The galactic plane dominates the emission pattern
- Beam Dilution: The finite beam size averages over spatial variations in the sky
This toy example provides a foundation for understanding more sophisticated foreground modeling techniques used in actual 21-cm experiments.
Repository
The complete code for this simulation is available on GitHub: foregrounds.
This simulation was created as an educational example of 21-cm foreground modeling techniques.